Which Cities Get the Most Eclipses?
By Graham Jones. Published 1-Apr-2024![]()
A new study from the astronomy team at timeanddate.com adds precision to eclipse frequency estimates—and reveals that locations near the polar circles have the most solar eclipses.
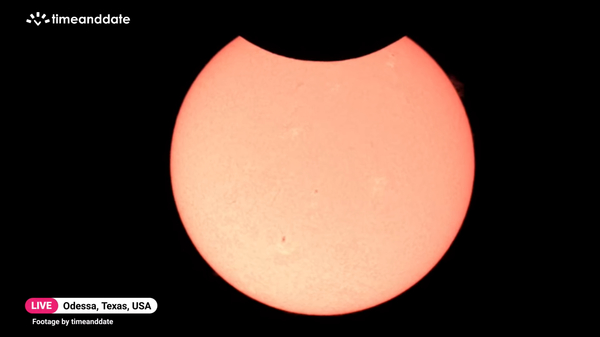
For a city in the world chosen at random, a partial solar eclipse happens once every 2.60 years on average, according to our new study.
©timeanddate.com
Looking At 15,000 Years of Eclipse Data
Contrary to popular belief, solar eclipses are not rare. A partial solar eclipse happens somewhere in the world every 5 months or so; a total eclipse occurs somewhere every 16 months on average.
All eclipses worldwide, 1900 to 2199
But how frequent are solar eclipses for a particular city? And do some cities get more eclipses than others?
As part of the build-up to the big solar eclipse across North America on April 8, 2024, the astronomy team at timeanddate.com has been studying 15,000 years’ worth of data.
We’ve narrowed down the estimates given in a classic 1982 paper, where astronomer Jean Meeus looked at data on total and annular eclipses over a period of 600 years.
We’ve also come up with new findings for partial eclipses, and new insights into the way that distance from the equator affects the frequency of eclipses.
On Average, Every 374 Years for a Total Eclipse
Our preliminary findings are shown in the table below, alongside the numbers from Meeus’s 1982 paper. The amount of uncertainty is indicated by the plus or minus sign. For example, 374 ± 7 means the number is somewhere between 367 and 381.
The figure for “partial” includes all solar eclipses of any magnitude, including total and annular eclipses.
The results suggest that, for a city chosen at random, a total solar eclipse happens once every 374 years on average. An annular eclipse occurs every 226 years, and a partial eclipse every 2.60 years.
Average number of years between solar eclipses for a particular location
| Total | Annular | Partial | |
|---|---|---|---|
| Meeus (1982) | 375 ± 16 | 224 ± 7 | Not given |
| timeanddate.com (2024) | 374 ± 7 | 226 ± 2 | 2.60 ± 0.02 |
Sources: timeanddate.com; JPL Ephemeris DE431; J. Brit. Astron. Assoc., 92,124
Find eclipses for your town or city
Eclipse Frequency Depends on Latitude
Meeus’s 1982 paper revealed a ‘latitude effect.’ The latitude of a city is its distance north or south of the equator, and this makes a difference to how often solar eclipses occur.
Our study uncovered more details about the latitude effect. For example, we showed that solar eclipses happen most frequently around the Arctic and Antarctic Circles.
In the following chart, the horizontal axis represents latitude. The vertical axis represents the average period of time between consecutive solar eclipses (of any magnitude) for a particular location. The shorter the waiting time from one eclipse to the next, the higher the frequency—and the more eclipses there are overall.
For cities near the equator, a solar eclipse occurs once every 2.8 years on average. In contrast, places close to the Arctic and Antarctic Circles get a solar eclipse every 2.2 years on average.
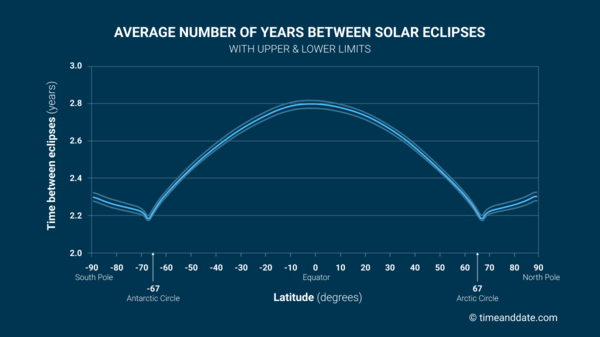
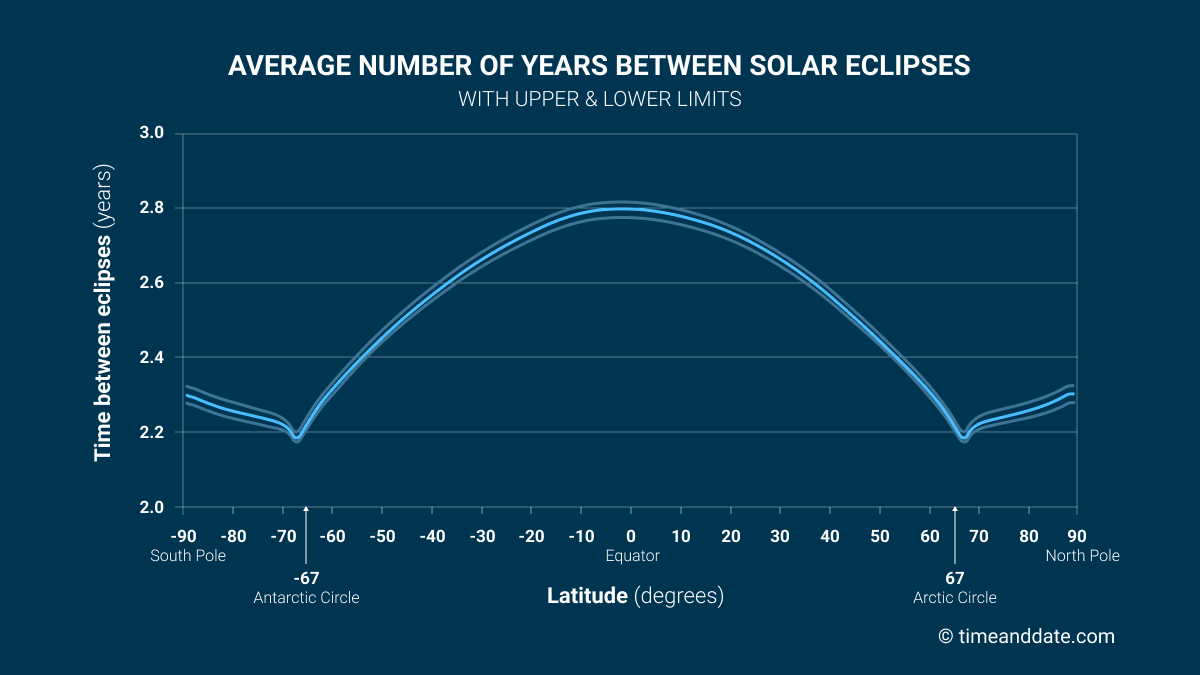
This chart shows the effect of latitude on the average frequency of partial solar eclipses for a particular location. (The thin gray lines indicate the upper and lower limits of the uncertainty range.)
©timeanddate
Why Do the Polar Circles Have the Most Eclipses?
Last year, we published an article on how cities at different latitudes receive different amounts of daylight over the course of the year. Daylight refers to the amount of time the Sun is above the horizon.
Overall, the Arctic and Antarctic Circles have more daylight than surrounding latitudes. In other words, the Sun spends more time above the horizon, which leads to more opportunities for solar eclipses to occur.
Other Latitude Effects on Eclipses
At the moment, total solar eclipses are more common in the Northern Hemisphere than in the Southern Hemisphere.
This is because the Northern Hemisphere summer—when the Sun spends the most time above the horizon—coincides with aphelion. Aphelion is the point in Earth’s orbit where the Earth is farthest from the Sun. If the Sun is farther away, it appears smaller, and there is a greater chance of the Moon being able to cover it completely.
This year, the date of aphelion is July 5. However, this date slowly shifts through the calendar, in a cycle lasting around 25,000 years. In about 10,000 years, aphelion will coincide with the Northern Hemisphere winter—and total solar eclipses will be more frequent in the Southern Hemisphere.
When we look at eclipse frequency charts for different millennia (periods of a thousand years), we can see long-term trends in the pattern of eclipses at different latitudes.
More than One Trillion Checks
Even with modern-day computing power, these kinds of eclipse calculations can take weeks to run.
One of the members of timeanddate’s astronomy team is Frank Tveter. “Retracing the footsteps of the famous astronomer Jean Meeus has been an exciting project—and a surprisingly challenging problem,” says Frank, who has a doctorate in celestial mechanics from the University of Oslo in Norway.
“Overall, we had to perform more than one trillion checks on eclipses, in order to calculate a single number.”
Notes on Our Eclipse Calculations
We arrived at our numbers by slicing the Earth into 180 latitude bands—narrow strips circling the globe, parallel to the equator.
Next, we took every solar eclipse during a period of 14,999 years, starting from the year 1 CE. For each eclipse, we measured how much of each latitude band is covered by the Moon’s shadow. From this, we calculated the average frequency of eclipses at different latitudes.
The exact size of the area covered by the Moon’s shadow is affected by a number of factors, including the shape and terrain of the Moon. For example, valleys and dips along the edge of the Moon make the Moon’s shadow slightly smaller.
It should be noted that 15,000 years is a long time span. Uncertainties and errors in the data increase as we move further and further away from the present day.
We are preparing a full paper for submission to the Journal of the British Astronomical Association.